

12 Free Unity Frame Debugger Tools After Echo Weaver Case Study - 2026
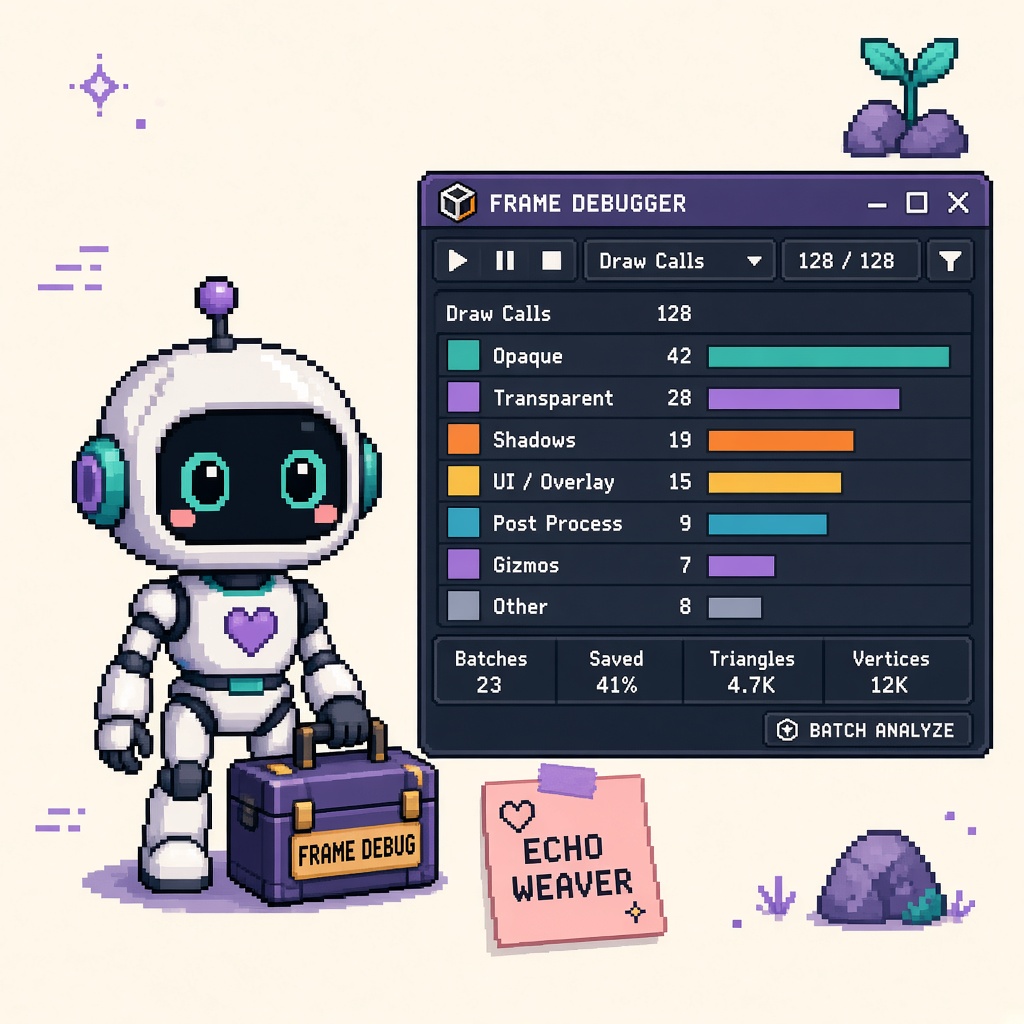
If you searched unity frame debugger after Unity published the Echo Weaver case study on October 8, 2026, you do not need another “optimize later” pep talk. You need a free creator toolkit: open the Frame Debugger, step draw calls, see where batching breaks, unify materials, convert stray sprites, recheck the frame, and file a receipt before Discord guesses GPU cost from the Game view alone.
In that interview, programmer Ankit Trivedi’s advice is blunt: “start using the Frame Debugger liberally, right away!” The team used it to step the frame draw-call by draw-call, find batch breaks, consolidate materials and sprites, and recheck until more of the frame batched. Unity’s Frame Debugger manual explains the same job in product language: pause on a frame, list rendering events, step through graphical state, find where issues arise.
Honesty first: “Free” here means no extra paid plugin tax — Editor Frame Debugger, Game view Stats, Profiler modules, URP Rendering Debugger (when on URP), and RenderDoc (free third-party with Unity native launch). You still need a Unity seat you already use. This is not a paid GPU vendor suite roundup.
This URL is not the live Frame Debugger batch-break smoke worksheet (fill-in lab gates). It is not the 14 free Unity XR debug utilities listicle (Quest/XR QA ladder). It is not a GLES device-matrix guide. Those own lab smoke, XR validation, and Android floor matrices. This URL owns the numbered free Frame Debugger / batching toolkit after Echo Weaver.
Why this matters now
October 2026 is when Unity’s Echo Weaver post puts Frame Debugger in the spotlight for small teams shipping dense 2D worlds on Unity 6. Indies hear “don’t optimize early,” then ship atlases without compression, four light types per sprite, and dozens of near-identical draw calls — then discover the Frame Debugger only after a console port panic. Without a toolkit, teams also confuse Frame Debugger with the Profiler CPU view, or open RenderDoc before they can read a single Editor event list.
Direct answer: Adopt a four-tool minimum this week — Frame Debugger framing, draw-call event stepping, batch-break note, material/sprite unify + recheck — then expand to the full twelve when Stats, Profiler GPU, URP Rendering Debugger, RenderDoc, SRP Batcher honesty, or lab-scene receipts still fail.
Who this list is for
| Audience | Use it to… |
|---|---|
| Beginners | Know which free clicks matter after Echo Weaver’s advice |
| Developers | Batch-break diligence without a custom GPU capture pipeline first |
| Creators | Paste a Discord shortlist that stops “optimize blind” folklore |
| Companies | CapEx four-liner — Frame Debugger before console overtime |
Time: 25 minutes to map the twelve; 45–90 minutes for the four-tool minimum on one lab scene.
Honest limit: Unity’s Echo Weaver post and Frame Debugger manual are authorities for the advice and the Editor tool. Re-read both before partner claims. Pipeline specifics (URP vs HDRP vs Built-in) change event names — verify on your project. Fill-in smoke lives on the live worksheet sibling.
Pair Unity craft with the Unity guide. Community paste: 25 free game development Discord servers. XR Quest ladders stay on the XR debug listicle.
Non-repetition
| URL | Job |
|---|---|
| Batch-break smoke worksheet | Fill-in lab smoke (live) |
| 14 free Unity XR debug utilities | Quest/XR QA toolkit |
| DEVELOPMENT_BUILD diagnostics Stop | Define folklore cousin |
| Unity GLES 3.1 device matrix | Android floor (queued) |
| Winter Sale prep worksheet | Seasonal clock |
| This URL | Free Frame Debugger / batching toolkit after Echo Weaver |
Selection criteria
A tool is in only if all are true:
- No extra paid add-on beyond your existing Unity seat (Editor windows, free RenderDoc, docs).
- Primary job is Frame Debugger literacy, batch breaks, draw-call consolidation, or companion GPU visibility.
- Tied to Echo Weaver’s documented advice and/or Unity Frame Debugger docs.
- Honest limits in one sentence.
- Not a rehash of the XR Quest listicle or GLES matrix as the main job.
Frame Debugger cheat sheet
| Family | Job | Extra paid plugin? |
|---|---|---|
| Framing | Echo Weaver advice + Manual intro | No |
| Core | Open Frame Debugger; step events | No |
| Batch | Find breaks; unify materials/sprites | No |
| Companions | Stats, Profiler GPU, URP Rendering Debugger | No |
| Capture | RenderDoc native launch | No (RenderDoc free) |
| Honesty | SRP Batcher / instancing limits | No |
| Proof | Lab scene + receipt | No |
Rule: Write the creator job in Discord before you open a vendor capture suite. “We should optimize” is not a job. “Step Frame Debugger on lab scene → note batch break → unify materials → recheck” is a job.
Four-tool minimum (do this before the other eight)
| # | Tool | Job after Echo Weaver |
|---|---|---|
| 1 | Echo Weaver + Frame Debugger docs framing | Know why and what the tool is |
| 2 | Frame Debugger window (open + enable) | Event list truth |
| 3 | Draw-call / event stepping | See the frame construct |
| 4 | Batch-break note → unify → recheck | Echo Weaver loop |
Latch the receipt only when these four are real (or deliberately skipped with reasons). Then add Stats, Profiler GPU, URP Rendering Debugger, RenderDoc, atlas/compression cousins, and lab-scene hygiene as needed.
Tool 1 - Echo Weaver case study framing (free)
Type: Primary trend / advice source
URL: Building Echo Weaver
Creator job: Anchor “use Frame Debugger liberally” in a shipped Unity 6 indie story — not abstract GPU wisdom.
How to use Monday
- Read the Debugging subsection: step draw calls, see batch breaks, consolidate, recheck.
- Note related wins in the same article (atlas compression, light-layer consolidation) as cousins, not substitutes.
- Link the page in receipt
outbound_refs.
Honest limit: Echo Weaver is one 2D-dense Unity 6 title — your HDRP shooter will show different event names.
Tool 2 - Frame Debugger Manual intro (free)
Type: Official product guide
URL: Frame Debugger
Creator job: Know what the tool can and cannot do across render pipelines.
How to use Monday
- Confirm Frame Debugger is available on your pipeline (URP / HDRP / custom SRP / Built-in — Manual compatibility table).
- Note the warning: event lists can update rapidly if draw counts thrash — stabilize the scene for reading.
- Know when to escalate to RenderDoc / standalone player attach.
Honest limit: Manual pages evolve with Unity versions — pin the version you ship.
Tool 3 - Frame Debugger window open + enable (free)
Type: Editor instrument
URL: Window → Analysis → Frame Debugger (path may vary slightly by version; Manual is truth)
Creator job: Get a live event list on a controllable lab scene.
How to use Monday
- Open a lab scene (not the busiest production level on first night).
- Enter Play Mode; enable Frame Debugger.
- Confirm the event list populates before you “fix” anything.
Honest limit: If Development Build diagnostics expectations are broken on Unity 6.6 defaults, see the DEVELOPMENT_BUILD Stop — different failure class.
Tool 4 - Draw-call / render-event stepping (free)
Type: Core Frame Debugger skill
Creator job: Walk the frame like Echo Weaver’s programmer — event by event — until you see where cost or batching fails.
How to use Monday
- Select early events; note what appears in the Game view / target.
- Step forward until a surprising draw or state change appears.
- Write the event name + why it surprised you in the receipt.
Honest limit: Stepping shows construction order — it does not auto-fix materials.
Tool 5 - Batch-break finder (free)
Type: Observation ritual on Tool 4
Creator job: Name the break (material change, shader keyword, light mode, mesh mismatch, etc.) before guessing.
How to use Monday
- When batches reset, note the preceding object’s material / shader / keywords.
- Compare to the next object that “should” have batched.
- Log one sentence: “Break cause hypothesis: ____.”
Honest limit: Hypotheses need a unify+recheck (Tool 6–7) — notes alone are not optimization.
Tool 6 - Material / keyword unify pass (free)
Type: Consolidation action (Echo Weaver pattern)
Creator job: Reduce needless material diversity that shatters batches.
How to use Monday
- From Tool 5’s hypothesis, unify materials or strip stray keywords on lab objects.
- Prefer shared materials for near-identical sprites/meshes when art allows.
- Re-open Frame Debugger after the change.
Honest limit: Art direction may require unique materials — then batch less and budget honestly (Echo Weaver flattened groups into composites when patterns could merge).
Tool 7 - Sprite / mesh consolidation cousin (free)
Type: Content-side batching helper (Echo Weaver sky example)
Creator job: When hand-drawn art avoids repeating patterns, consider flattening groups into fewer sprites / meshes for fewer draw calls.
How to use Monday
- Identify a cluster of near-identical decorative draws.
- Evaluate a composite / atlas approach vs live individuality.
- Recheck Frame Debugger after the content change.
Honest limit: This is art pipeline work — not a Frame Debugger button. Do not destroy authoring flexibility for a 2% win without CapEx owner buy-in.
Tool 8 - Game view Stats window (free)
Type: Quick companion metric
Creator job: Pair Batches / SetPass / Tris with Frame Debugger narrative.
How to use Monday
- Enable Stats in Game view on the same lab scene.
- Capture before/after numbers around Tool 6–7.
- Never declare victory from Stats alone without a Frame Debugger recheck.
Honest limit: Stats can lie about why; Frame Debugger explains why.
Tool 9 - Profiler GPU / Rendering module (free)
Type: Timing companion
Creator job: Separate “many draws” from “expensive draws.”
How to use Monday
- Profile the same lab scene after Frame Debugger identifies a hotspot family.
- Ask: is cost draw count, fill rate, or CPU render thread?
- Escalate only the family that matched.
Honest limit: Profiler ≠ Frame Debugger. Use both; do not substitute one for the other.
Tool 10 - URP Rendering Debugger (free when on URP)
Type: Pipeline overlay companion
Creator job: When bands disagree (lighting vs pass order vs keywords), pair with Frame Debugger.
How to use Monday
- If on URP, open Rendering Debugger overlays relevant to your suspicion.
- Cross-check Frame Debugger event list against overlay clues.
- If on HDRP/Built-in, skip this tool and document N/A — do not force URP folklore.
Honest limit: Not universal across all pipelines. XR Quest ladders with Rendering Debugger live on the XR listicle.
Tool 11 - RenderDoc native launch (free)
Type: Third-party capture (Unity supports native launching)
URL: RenderDoc + Unity Manual notes on Profiling tools / Frame Debugger escalation
Creator job: Capture frames Frame Debugger cannot pause/read when events thrash, or when you need API-level detail.
How to use Monday
- Only after Tools 1–4: escalate when the Editor event list is unreadable or insufficient.
- Capture a minimized lab scene, not the full production chaos first.
- Bring one concrete question into RenderDoc (“why did this material break the batch?”).
Honest limit: RenderDoc has a learning curve — do not open it to avoid learning Frame Debugger.
Tool 12 - Lab-scene + toolkit receipt (free)
Type: Diligence instrument
Creator job: Prove the four-tool minimum happened; refuse “we optimized” folklore.
How to use Monday
- Name the lab scene and Unity version.
- List tools used (minimum 1–4).
- File
unity_frame_debugger_toolkit_receipt_v1.jsonthe same hour.
Honest limit: Receipts without before/after notes are theater.
Beginner path — 60 minutes
- Read Echo Weaver Debugging blurb + Frame Debugger Manual intro (Tools 1–2).
- Open a lab scene; enable Frame Debugger (Tool 3).
- Step events until one batch break is visible; write the hypothesis (Tools 4–5).
- Unify one material family; recheck (Tools 6–7).
- Snapshot Stats before/after (Tool 8).
- File the receipt (Tool 12).
- Skim Tools 9–11 only if the break remains mysterious.
Common beginner mistakes:
- Opening RenderDoc before reading one Editor event list.
- “Optimizing” production levels on night one.
- Changing five systems at once so recheck proves nothing.
- Treating Stats drop as proof without Frame Debugger.
- Assuming URP Rendering Debugger exists on Built-in.
- Quoting Echo Weaver’s 2D flattening as mandatory for every art style.
- Using this listicle as the fill-in worksheet (live sibling owns gates).
- Declaring SRP Batcher “on” without checking event evidence.
Developer path — failure modes and forks
Batch-break taxonomy
| Symptom | Likely class | Next tool |
|---|---|---|
| New material every object | Material diversity | Tool 6 |
| Keyword / light mode flip | Shader variants | Tool 6 + 10 |
| Unique meshes / sprites | Content consolidation | Tool 7 |
| Transparent / UI interlacing | Pass order | Tools 4–5 |
| Event list thrashing | Unstable scene | Stabilize; Tool 11 |
| Cost high, draws few | Expensive shaders / fill | Tool 9 |
When to leave this listicle
| Problem | Go here |
|---|---|
| Fill-in batch-break smoke gates | Live batch-break worksheet |
| Quest / XR validation ladder | XR debug listicle |
| DEVELOPMENT_BUILD define folklore | DEVELOPMENT_BUILD Stop |
| Android GLES floor matrix | Queued GLES matrix |
What not to automate yet
- CI that fails builds on draw-call counts without scene contracts.
- Nightly RenderDoc dumps nobody reads.
- Material unifiers that rewrite art without owner review.
Failure modes this toolkit catches
| Failure | Symptom | Fix |
|---|---|---|
| Blind optimize | Random LOD/shader flips | Four-tool minimum |
| Stats-only diligence | Numbers without why | Tools 4–5 |
| RenderDoc-first FOMO | Capture with no question | Tools 1–4 first |
| Scene thrash | Unreadable event list | Stabilize lab scene |
| Pipeline mismatch | Expecting URP overlays on Built-in | Tool 10 N/A honesty |
| Art vs batch fight | Forced merges that break style | CapEx + Tool 7 limits |
| Define folklore | Missing debug windows on 6.6 | DEVELOPMENT_BUILD Stop |
Anti-patterns (reject in review)
- “Don’t optimize early” as an excuse to never open Frame Debugger.
- “Stats look fine” without event stepping.
- “RenderDoc will teach us later” skipping Editor first.
- Changing production lighting, materials, and post in one commit.
- Claiming Echo Weaver’s composite sky tool as a Unity menu item you don’t have.
- “This listicle replaces the batch-break worksheet.”
- “XR listicle already covered Frame Debugger — delete this.”
- Forcing GLES matrix work into a Frame Debugger night.
Worked decisions
Studio A — first Frame Debugger night, dense 2D
Do: Four-tool minimum on a lab biome slice; file receipt.
Don’t: Flatten the whole art bible overnight.
Studio B — Stats say high batches, no idea why
Do: Tools 4–5; write break hypothesis before Tool 6.
Don’t: Toggle SRP Batcher randomly.
Studio C — URP project, lighting expensive
Do: Tools 4 + 9 + 10; compare light layers like Echo Weaver’s consolidation story.
Don’t: Skip Frame Debugger and only tweak light counts by feel.
Studio D — event list updates too fast to read
Do: Stabilize scene / reduce thrash; then Tool 11 if still needed.
Don’t: Screenshot spam as diligence.
Studio E — Quest release QA week
Do: Use this toolkit for Editor GPU literacy; escalate XR ladder on the XR listicle.
Don’t: Merge both nights into one confused Discord thread.
Studio F — Unity 6.6, debug overlays “missing”
Do: Check DEVELOPMENT_BUILD Stop before blaming Frame Debugger.
Don’t: Assume Frame Debugger died because defines changed.
Studio G — wants fill-in gates tonight
Do: Use this map; run the live worksheet for B-gates.
Don’t: Invent a fake gate schema in Slack.
CapEx four-liner
- Asset at risk: Console overtime, art thrash, and “optimize week” that changes everything.
- Change proposed: GPU work without Frame Debugger evidence.
- Cost if wrong: Broken art direction, unreadable captures, missed ship buffers.
- Decision owner: Tech/art lead; default = four-tool minimum on a lab scene first.
Two-week calendar
| Day | Focus | Tools |
|---|---|---|
| Mon | Framing + open Frame Debugger | 1–3 |
| Tue | Step events + batch-break note | 4–5 |
| Wed | Unify materials/sprites + recheck | 6–8 |
| Thu | Profiler / URP companion as needed | 9–10 |
| Fri | RenderDoc only if stuck + receipt | 11–12 |
Discord shortlist (paste)
Unity Frame Debugger — free toolkit after Echo Weaver (minimum 4)
1) Read Echo Weaver Debugging advice + Frame Debugger Manual
2) Open Frame Debugger on a lab scene
3) Step draw calls / events until a batch break is visible
4) Unify materials or consolidate content → recheck
Then: Stats, Profiler GPU, URP Rendering Debugger, RenderDoc
Worksheet (live): unity-frame-debugger-first-indie-batch-break-smoke-worksheet-2026
≠ XR Quest debug listicle · ≠ GLES device matrix
Sources: unity.com/blog/echo-weaver-time-loop-unity · docs Frame Debugger
Receipt — unity_frame_debugger_toolkit_receipt_v1.json
{
  "receipt_type": "unity_frame_debugger_toolkit_receipt_v1",
  "filled_at": "2026-10-14",
  "unity_version": "",
  "lab_scene": "REPLACE",
  "four_tool_minimum_pass": false,
  "tools_used": [1, 2, 3, 4],
  "batch_break_hypothesis": "",
  "unify_or_consolidate_done": false,
  "recheck_improved": false,
  "stats_before_batches": null,
  "stats_after_batches": null,
  "renderdoc_escalated": false,
  "owner": "",
  "notes": ""
}
Key takeaways
- Twelve free tools beat “optimize blind” folklore after Echo Weaver.
- Four-tool minimum — framing, open Frame Debugger, step events, unify+recheck.
- Echo Weaver: use Frame Debugger liberally, right away.
- Frame Debugger shows how the frame is built — Stats alone do not.
- Name the batch break before changing art.
- Material unify and content consolidation are different levers.
- RenderDoc is escalation — not night-one homework.
- URP Rendering Debugger is companion / N/A by pipeline.
- This listicle ≠ XR Quest toolkit ≠ batch-break worksheet.
- CapEx favors lab scenes before production thrash.
- File the receipt JSON.
- Primary keyword: unity frame debugger.
FAQ
What did Echo Weaver say about the Frame Debugger?
Ankit Trivedi described stepping the frame draw-call by draw-call to see where batching broke, then consolidating materials/sprites and rechecking — and advised teams to use the Frame Debugger liberally, right away. See Building Echo Weaver.
How do I open Unity’s Frame Debugger?
Use the Editor Frame Debugger window (see Frame Debugger Manual for your version). Enable it on a stable Play Mode frame and step rendering events.
Is RenderDoc required?
No for the four-tool minimum. Unity notes third-party debuggers (including RenderDoc native launch) when Frame Debugger is insufficient — escalate with a question, not FOMO.
How is this different from the batch-break worksheet?
The worksheet is the fill-in lab smoke with gates. This URL is the numbered free toolkit after Echo Weaver.
How is this different from the XR debug listicle?
The XR listicle owns Quest/release QA ladders. This URL owns Frame Debugger / batching toolkit literacy for general Unity projects after Echo Weaver.
What primary keyword does this page target?
unity frame debugger — free toolkit after the Echo Weaver case study.
Related reading
- Unity Frame Debugger First Indie Batch-Break Smoke Worksheet 2026 — lab sibling (live)
- 14 Free Unity XR Debug and Validation Utilities - Quest Release QA 2026
- Stop Expecting DEVELOPMENT_BUILD Diagnostics on Default Unity 6.6 Dev Builds - 2026
- Unity Android OpenGLES 3.1 Floor - Indie Device Matrix After 6.6 2026
- Steam Winter Sale 2026 Prep Worksheet - Lock Before Dec 17
- Unity Guide
- 25 Free Game Development Discord Servers
Primary sources: Building Echo Weaver · Frame Debugger Manual.
Conclusion
Echo Weaver’s gift to small Unity teams is not a secret GPU plugin — it is permission to open the Frame Debugger early and often. Step the frame. Name the batch break. Unify what art allows. Recheck. File a receipt.
Run the four-tool minimum this week. Expand to twelve when the failure mode demands it. Ship verified batching craft, not Discord folklore.